Mapping the Pandemic and the Future with GIS
When you say COVID-19, thoughts of the toilet paper supply, the economy, and healthcare challenges come to mind. But, one thing many people don’t automatically associate with times like these, even though they use its results every day, is Geographic Information Systems (GIS).
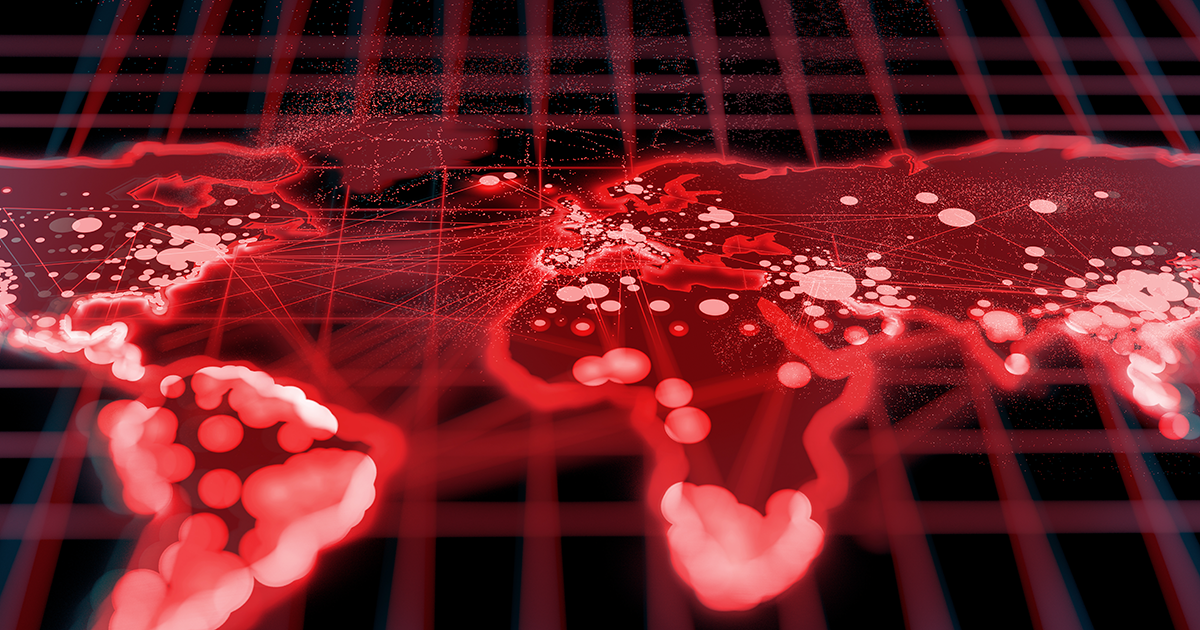
During the pandemic, many people accessed an online map, created by Johns Hopkins University, which displayed an almost real-time view of coronavirus cases throughout the world. It was featured on the news, millions have looked at it and other similar maps, and it’s all thanks to GIS.
“Sometimes it takes a disaster or emergency to bring GIS to the foreground. Now, COVID-19 is putting it in the news,” said Steven Hick, department director of Geographic Information Systems at University College at the University of Denver.
The role the technology plays in times of crisis, like the pandemic, as well as in the world beyond was the topic of recent webinar hosted by the University of Denver. During the event, Hick and University College Adjunct Professor Joseph Kerski discussed where GIS has been and where advancements are taking it.
GIS Touches Everything
While GIS is currently in the news for mapping a variety of coronavirus-related issues, the technology isn’t limited to any one field. From healthcare to civil engineering and national security to business, GIS is critical to a wide variety of industries and decisions.
“I remember 2001 when terrorists struck U.S. soil, and we scrambled to make maps and understand what happened and what to be done domestically and abroad,” said Hick.
GIS and GPS was used to inventory the damage of Hurricane Katrina, as well as to provide supplies to the stranded. It’s also often used to assess conditions for construction or predict the potential implications of emergencies like earthquakes.
GIS data is also used for environmental management, such as tracking pine beetle infestation. In the business arena, it’s ideal to analyze customer location, customer time spent in retails stores, and much more information critical to marketing and the bottom line.
In other words, GIS really serves as a foundation to building rich, engaging resources for most any use.
“It produces data to tell a story and to get information across to clients, a board of directors, customers, or even the general public,” Kerski said.
GIS Goes Online
According to Kerski, data sets are increasingly available online and accessible to more people across the globe. This allows almost anyone to create a data dashboard, such as the Johns Hopkins COVID-19 map, almost immediately.
“These tools and these data sets are increasingly being served online, by your local government, by private companies, by the Nature Conservancy and other nonprofits, by private companies, etc. So there’s no shortage of data,” said Kerski. “The data can be used to create the kind of information that people are consuming nowadays.”
With this dearth of data available, it’s also opening up unlimited chances for collaboration, which is key to understanding local, national, and global challenges, as well as their solutions. Whether it’s health, biodiversity loss, urban sprawl, water quality or climate, GIS technology and data play an important part.
“We’ve got to be able to collaborate across disciplines. We need the sociologists, and economists, and the business people, and the geographers, and the planners, and all those people collaborating. We’re not going to get there until we have effective ways to share data, to share models, and to share methods,” Kerski said.
An emerging way to do that is through advances in entirely online, mapping and analysis GIS technology. These tools are bringing technology previously only available to professionals right to the fingertips of almost anyone with an internet connection and an interest.
For example, in the case of the current pandemic, any user could plug publicly available, online health data into the technology and map hot spots or recovery areas, as well as predict potential affected areas or trends on a local to national scale. In this case, a user could range from a government official to a private citizen wanting to know about the recent cases in a local area.
In addition to accessibility, these online tools also help create a comprehensive story of an issue, serving as a hub of information that contains maps and other data, such as news sources and other real-time resources.
“The point is not to just make maps. The point is to understand something better deeper in a richer way. The beauty, the wonder, and the glory of modern geographic technologies is that they’re providing real solutions for people on an ongoing basis,” Kerski said.
Interested in hearing more from our experts? You can watch the entire, information-packed webinar on the University College Vimeo page.
If you would like to pursue a deeper understanding of GIS through a graduate degree or certificate from University College, reach out to Enrollment Manager David Rossi (david.rossi@du.edu or 303-871-3634).
-
June 18, 2024
When Everything Can Be Mapped, Maps are Everything
Joseph Kerski, a GIS adjunct faculty member and Enrichment Program instructor at DU, is an evangelist for geography, mapping, and GIS education.
-
June 7, 2024
Enrichment Classes Offer Taste of Cutting-Edge Research
With the free R1 Series within the Enrichment Program's slate of short noncredit classes, you can get a taste of DU's prominent research activity.
-
March 1, 2024
Q&A: Communication Management Program Looks Constantly Ahead
Academic Director Dr. Cindy Cragg keeps her finger on the pulse of the communications field in order to ensure the program stays cutting-edge and relevant to professionals in the industry.
-
February 2, 2024
For Great ROI, Invest in Yourself
If you’re seeking to expand your horizons, a University College credential can give you an exceptional education and help you stand out.